 Financial Operations (FinOps)
 Autoscaling applications
 Amazon Web Services
 Big data
 Container infrastructure
 Microsoft Azure
 Reserved commitment management
 Cloud services for MSPs
 Google Cloud
 Spot Overview
 About NetApp
 Elastigroup
 Ocean
Ocean Ocean CD
 Eco
Eco CloudCheckr
 Apache Cassandra
 Spot Security
 Case Studies
 Resource Center
 Documentation
 News
News Service Status
 CloudOps hub
 2023 State of CloudOps
 Our Story
 The Spot Team
 Contact Us
 Our Values
 Careers
 Reading Time: 2 minutes
Spectrum is a cloud agnostic, cross-platform monitoring and analytics service provided by Spotinst which enables real-time visibility, historical insights and event-driven alerts.
Spectrum provides visibility into the performance, uptime, and overall health of applications. Spectrum collects metrics from any cloud provider or even from on-premise servers, ingests the collected data and provides insights via customized dashboards, reports, and advanced alerting system.
Spectrum’s insights making it easy to understand the relationship between different components even when deployed in separate environments, analyze application performances and troubleshoot existing issues from a single console.
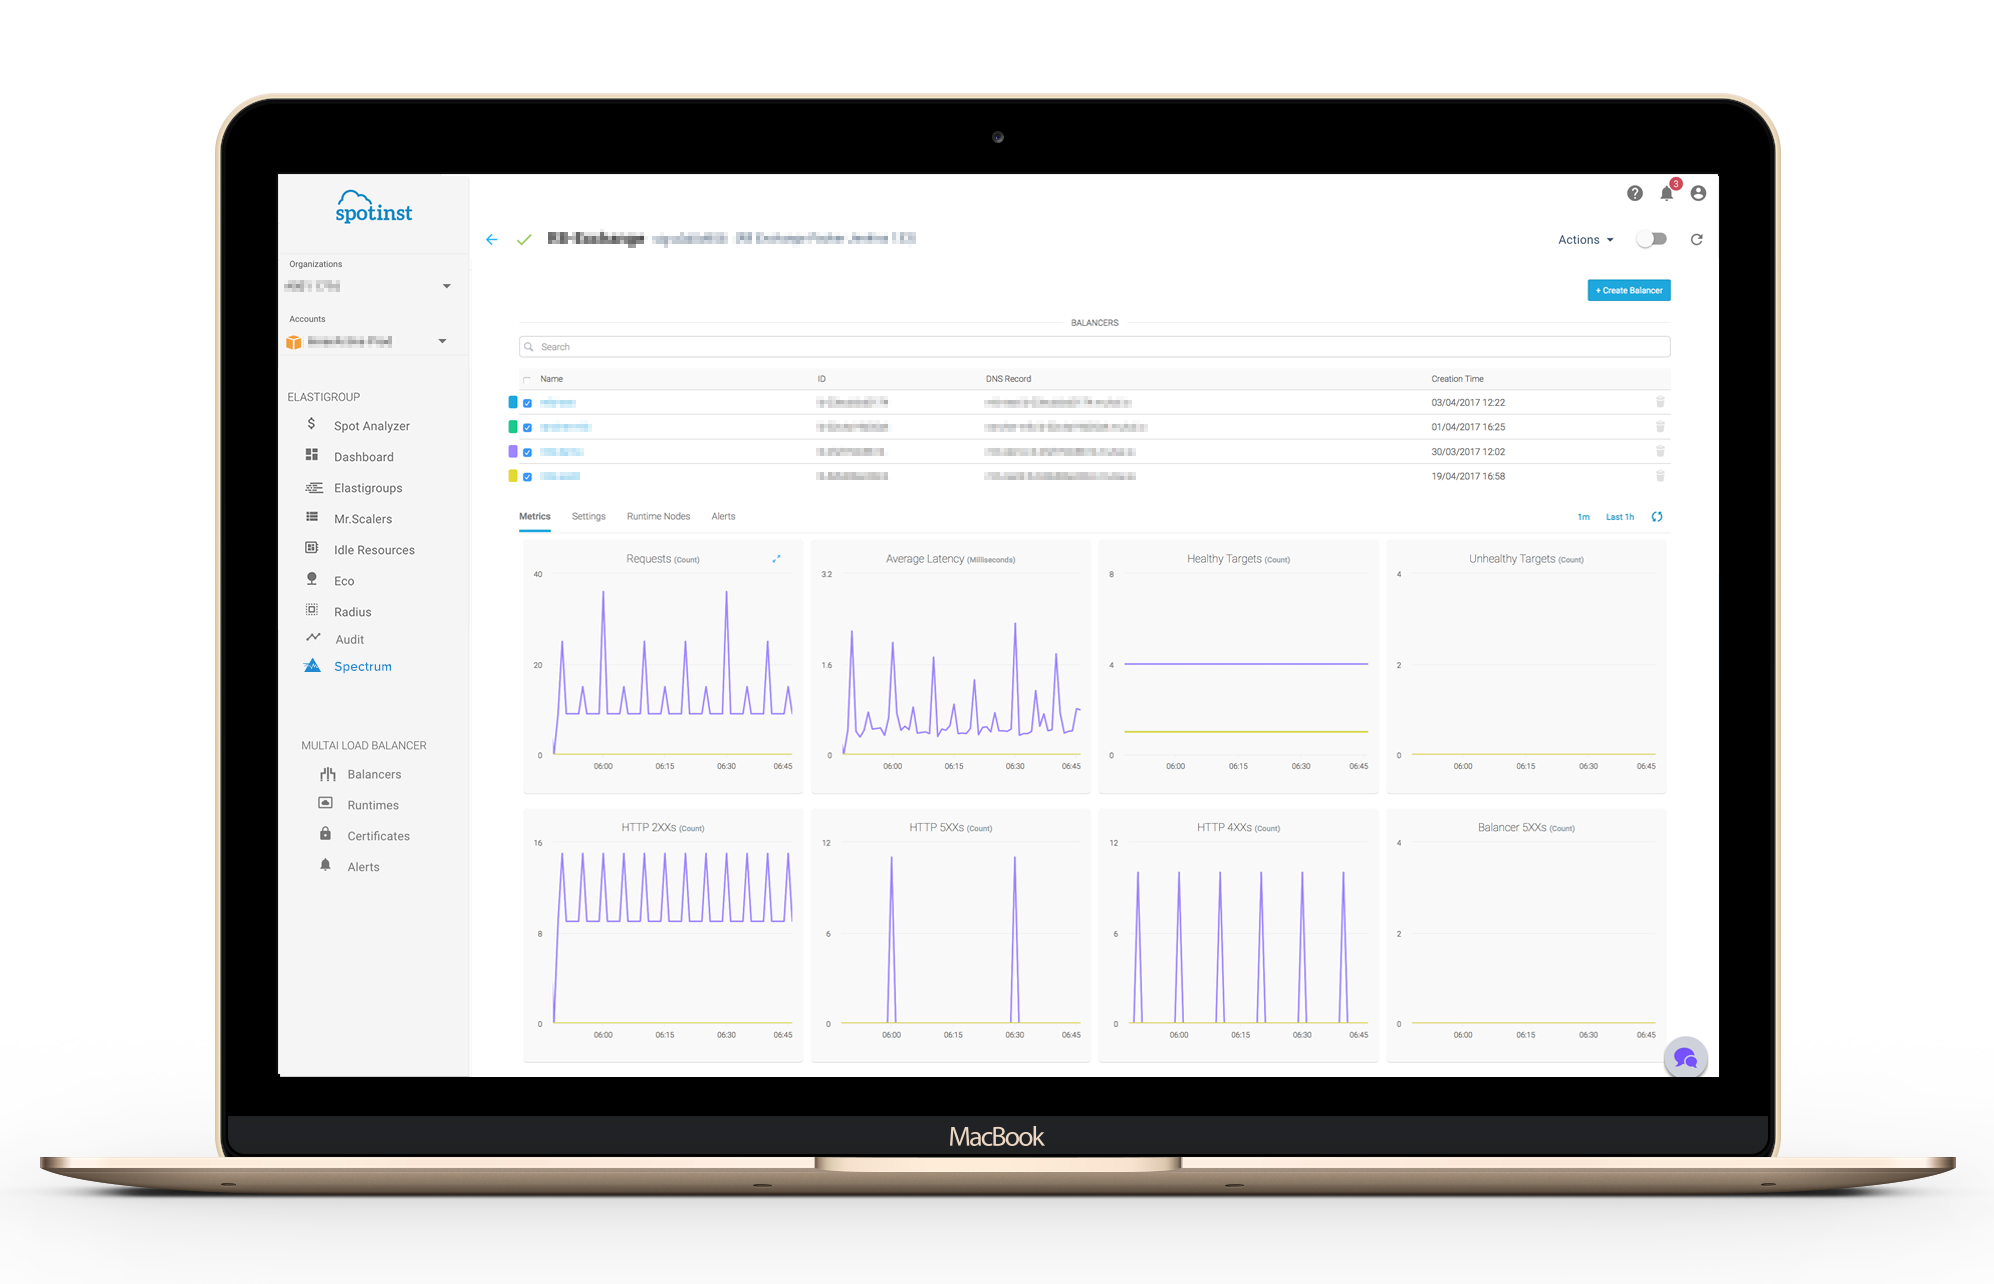
Custom metrics
Trivial metrics such as CPU, Memory, Disk, and Network or your very own application-specific metrics such as number of connection, application latency or any other metric that you find relevant, Spectrum can handle it all, Report your metrics using a simple RESTful APIs or SDKs to the Spectrum service to digest and analyze the data, making it the easiest and the most cost-effective way to monitor your applications based on any variable or aspect that you would like.
How does it work
Spectrum API allows you to query and report metrics to the Spectrum service. When reporting metrics to Spectrum you will need to provide the following information:
- A namespace in which we will register the metrics.
- Metrics data such as name, value, and unit.
- A dimension which is associated with the metric.
When querying a metric the following data is required:
- Metric namespace
- Metric name
- Statistic (sum,count,minimum,maximum or average)
- A dimension
- Date range
- Time Interval on which the metrics are aggregated on (1m, 5m, 15m, 30m, 1h, 2h, 6h, 12h, and 24h)
Examples
Report Data
URI
POST https://help.spotinst.io/spectrum/metricData?accountId=<YourAccountID>
Headers
Authorization: Bearer <Token> // Spotinst Token
Body
{
 "metricData": [
   {
     "namespace": "myOrganization",
     "dimensions": [
       {
         "name": "target_set_id",
         "value": "ts-12345"
       }
     ],
     "metrics": [
       {
         "name": "http_status_4xx",
         "value": 10,
         "unit": "count"
       }
     ]
   }
 ]
}
Query Data
URI
POST https://help.spotinst.io/spectrum/metricStatisticsQuery?accountId=<YourAccountID>
Headers
Authorization: Bearer <Token>
Body
{
 "namespace": "myOrganization",
 "metricName": "http_request_latency",
 "timeInterval": "1m",
 "statistic": "average",
 "dimensions": [
   {
     "name": "target_set_id",
     "value": "ts-12345"
   }
 ],
 "dateRange": {
   "from": "1970-01-01T01:00:00.000Z", // 1483232400000
   "to": "1970-01-01T12:00:00.000Z"    // 1483232412345
 }
}
For more information please read our API documentation
Elastigroup Integration
Spectrum collected metrics can be leveraged for scaling policies when using Elastigroup, meaning that you can scale your application based on any parameter that you would like providing you with flexibility. The same metrics can also be used to determine the health of the application so if your performance is poor you could replace the instance seamlessly and automatically.
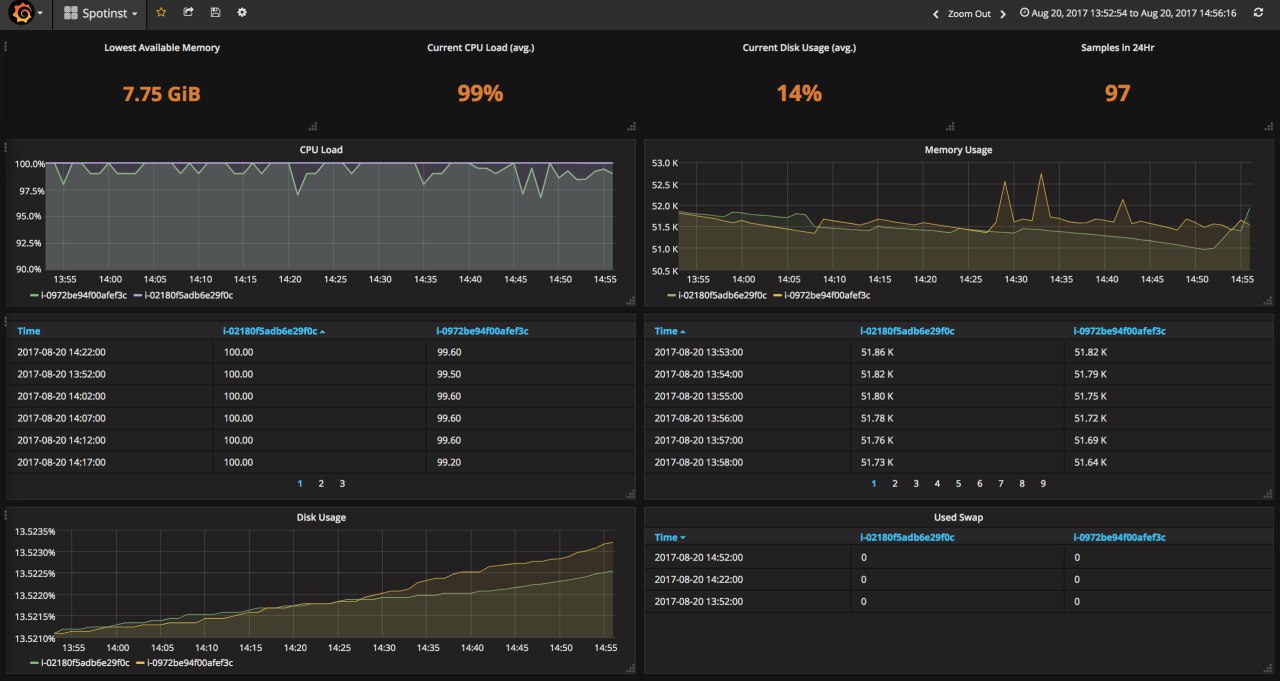
Analytics
Spectrum integrates with leading analytics services such as Grafana to enable an easy access and view to the entire data stored in Spectrum.
Learn how to configure Grafana plugin In our help center.
Get Started for Free today,
Best Regards,